やったこと
matplotlib.pyplot.barh を使ってみます
確認環境
$ ipython --version
6.1.0
$ jupyter --version
4.3.0
$ python --version
Python 3.6.2 :: Anaconda custom (64-bit)
import matplotlib
matplotlib.__version__出力結果
'2.0.2'調査
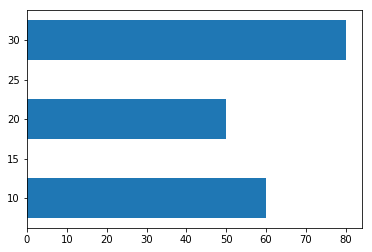
import matplotlib.pyplot as plt
%matplotlib inline

y = [10, 20, 30]
x = [60, 50, 80]
plt.barh(y, x, height=5)
出力結果
<Container object of 3 artists>